Providing optical design and development.
Customized design.
In most LED applications, directly using LEDs as emitters usually cannot meet the requirements of which are spot lighting, wide-angle illumination or asymmetric light pattern because of the light distributions from regular lighting LEDs. The Lambertion type light distribution is most common. Facing the various requirements of light patter, one needs optical components, lens or reflector, to meet the different light pattern applications.
When deciding to develop key optical components, such as lens called secondary lens, the prior decision to make is how to build the LED light emitter in an optical simulation model. The figure below illustrates four common methods of building the LED light emitter, from left to right: theoretical point source, geometrical LED packaged model, apodization equivalent to LED, and measured ray-file.
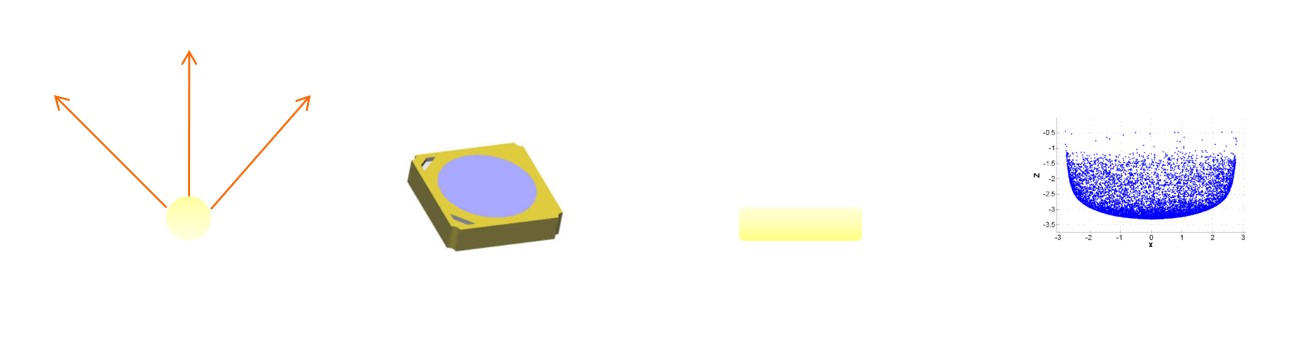 Figure 1: Common Methods of Building LED Emitter. [1]
[1]: Illustration figures are obtained from the internet.
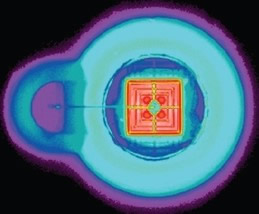
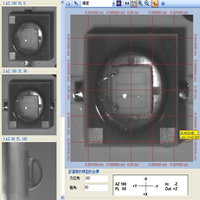
There are several methods to measure a LED and export a ray-file used in non-imaging optical simulation, for instance, the method used by OSRAM*Semiconductors measures blue and yellow wavelengths emitted from LED. It generates two ray-files. One impots the two ray-files into optics software to create dual emitters. Then, sets the suitable power ration for each emitter. The mixed blue and yellow rays will be white light prior to a short distance. The most widely used method in the industry of optics simulation is Radiant*imaging-based measurement ray file. The picture of Radiant's equipment is shown on the left of figure 2. The CCD image obtained from the light emitter is shown on the right of figure 2. The equipment measures picture of light emitter through an imaging optics system. Although the measurement’s sensor is located approximately 300 mm away from the light emitter, the focus is at the LED light emitter. The instrument records the surface characteristics in all directions through spatial scanning, resulting in light emitter ray information with near-field optical properties.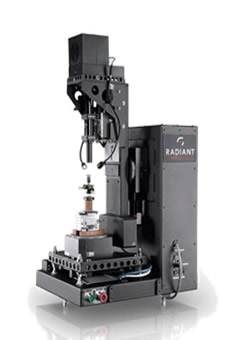 |
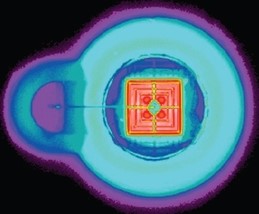 |
| Figure 2: Radiant's Measurement Equipment and CCD Image | |
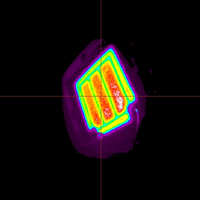
When getting the measured ray-file, one can open the file with Prosource software provided by Radiant. Prosource can analyze and extract relevant characteristics of the measured ray stored in the ray-file, as shown below. Images shown in figure 3, from left to right, they are LED appearance, LED CCD image, and far-field intensity characteristics. The most important feature is to use Prosource to convert LED CCD information into ray-file. These various format files can be imported into corresponding non-imaging optical simulation software to be a simulated emitter model.
 |
 |
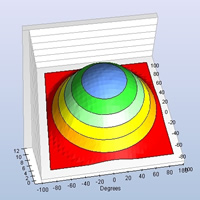 |
| Figure 3: Example of Prosource Light Source File Information for LED Light Source | ||
***The above images are taken from the Radiant official website. SIG 400 and Prosource are products of Radiant.
We Cite Mark and Kurt’s “LED Source Modeling Method Evaluations"[2] from “LED Professional” magazine[3] published in November/December 2008. In this paper, Type 1 model refers to using Radiant’s ray-file, and the LED’s geometry is only for prestation without any optical property. Type 3 model refers to build a precious emitter model with considering influence of LED’s package by Photopia[4]. The emitter model includes optical characteristics of the chip, glue and cup of the LED’s package. After importing Type 1 emitter into a standard streetlight design and simulating, one can obtain the simulated light intensity of red line shown Figure 4. The black line represents the actual measured light intensity. Comparing the two curves, there is a good match at low angles, but obviously differences at the maximum angle position, which might determine the measured light pattern will pass the streetlight regulations or not. The Figure 5 shows the results from using the Type 3 model, one can see that the match at the maximum angle is better than one from using Type 1 model.
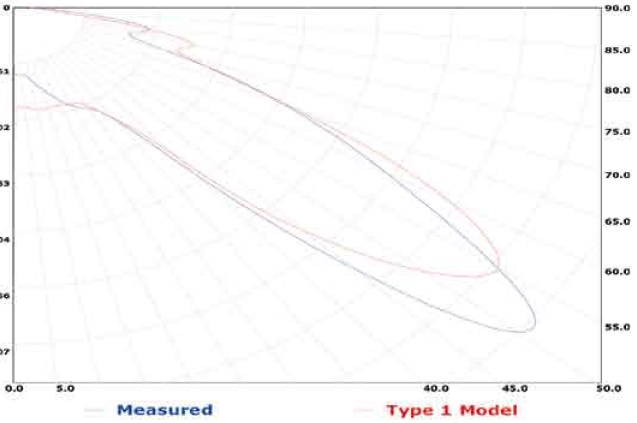 Figure 4: The results obtained by the type 1 model and the practical measured for a streetlight design [2].
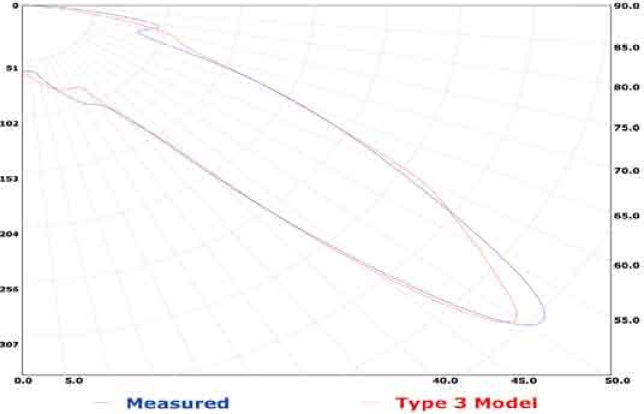 Figure 5: The results obtained by the type 3 model and the practical measured for a streetlight design [2].
[2] Mark Jongewaard, Director of Engineering, LTI Optics; Kurt Wilcox, Engineering Manager, Ruud Lighting, "LED Source Modeling Method Evaluations,"Led Professional, pp. 36-40, 2018, November/December issue.
[3] LED Professional is a well-known online professional journal for LEDs and LED applications.
[4] Photopia is a renowned non-imaging optical simulation software.
Another method of building a light emitter is to use a ray-file provided by OSRAM. The ray-file includes a simulation model with two emitters of different wavelengths placed at the same position. One can input a prior radiative power ratio for the two emitters. That will mix the two spectrums to form a colour expected by a designer. However, it should be noted that this method is only suitable for far-field designs. In near-field applications, the color distribution may be not much realistic. Some well-known non-imaging optical software tools, such as Lucidshape and Zemax, define the colour of light emitter based on a given spectrum distribution. When one wants to observe the colour distribution much closing the emitter, this is a key point for building a emitter model.
* Visit the Lucidshap official website for more information on non-imaging optical software well known as automotive lighting design and analysis.
** Visit the Zemax official website for more information on imaging and non-imaging design and analysis.
No. 53, Yuanbai Road, Economic and Technological Development Zone, Longquanyi District, Chengdu City, Sichuan Province
TEL:15198055548
FAX:+86-28-84851939